base on Lightweight network IP scanner written in Go. With notifications, history, export to Grafana <h1><a href="https://github.com/aceberg/WatchYourLAN">
<img src="https://raw.githubusercontent.com/aceberg/WatchYourLAN/main/assets/logo.png" width="20" />
</a>WatchYourLAN</h1>
<br/>
[](https://github.com/aceberg/WatchYourLAN/actions/workflows/main-docker-all.yml)
[](https://goreportcard.com/report/github.com/aceberg/WatchYourLAN)
[](https://hub.docker.com/r/aceberg/watchyourlan)
[](https://github.com/aceberg/WatchYourLAN/discussions)
<a href="https://trendshift.io/repositories/11642" target="_blank"><img src="https://trendshift.io/api/badge/repositories/11642" alt="aceberg%2FWatchYourLAN | Trendshift" style="width: 250px; height: 55px;" width="250" height="55"/></a>
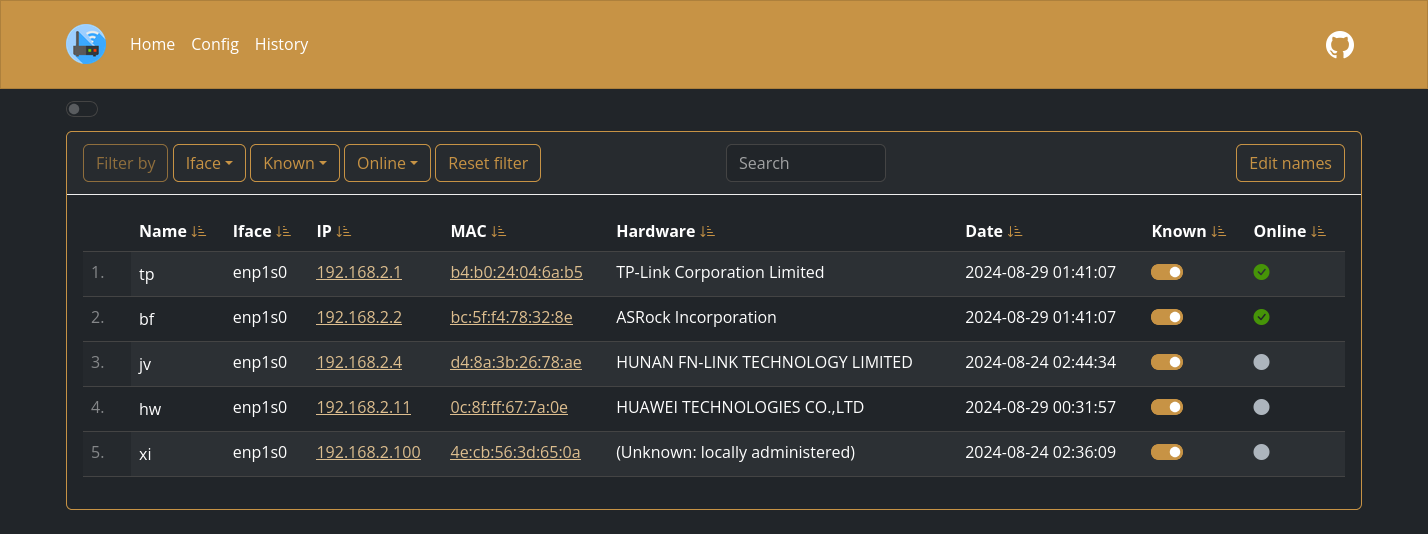
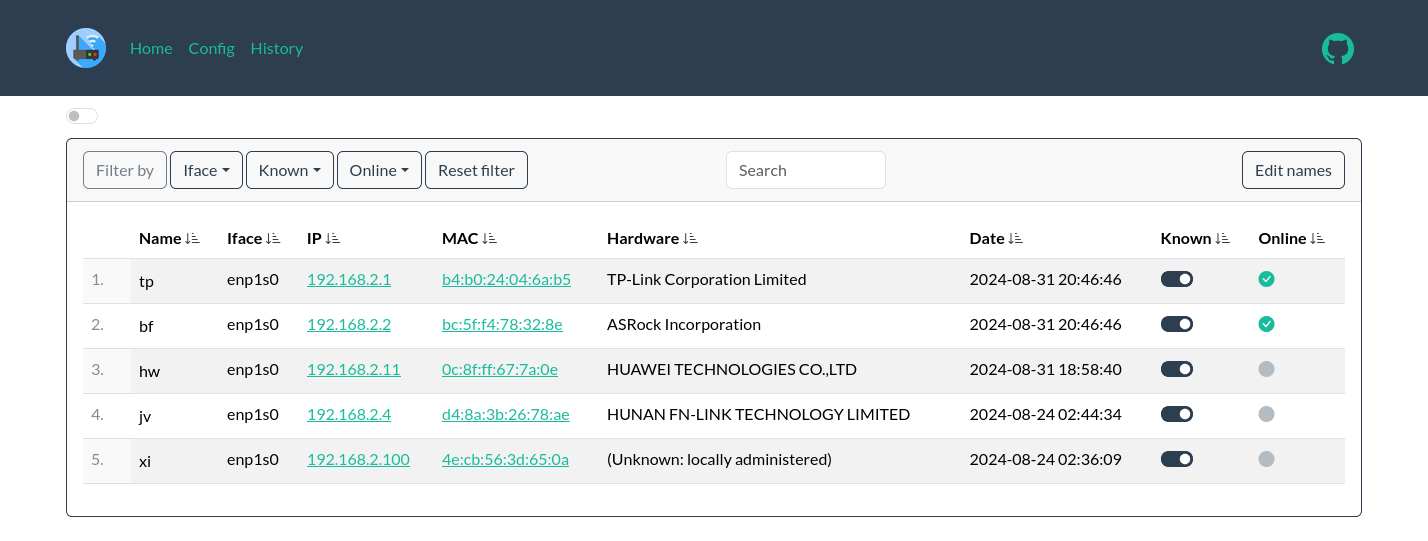
Lightweight network IP scanner with web GUI. Features:
- Send notification when new host is found
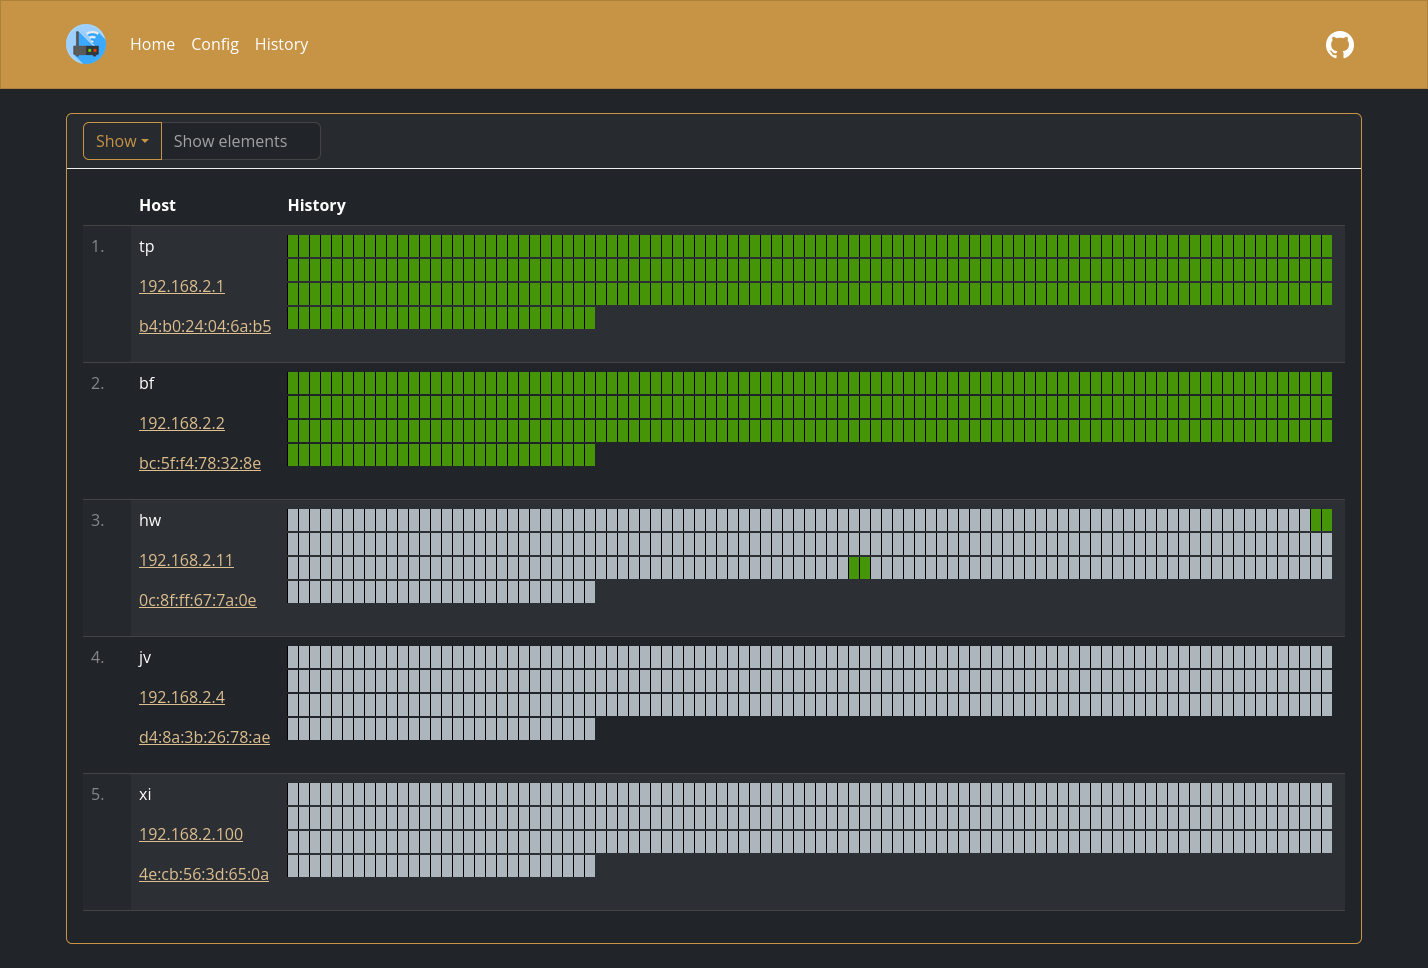
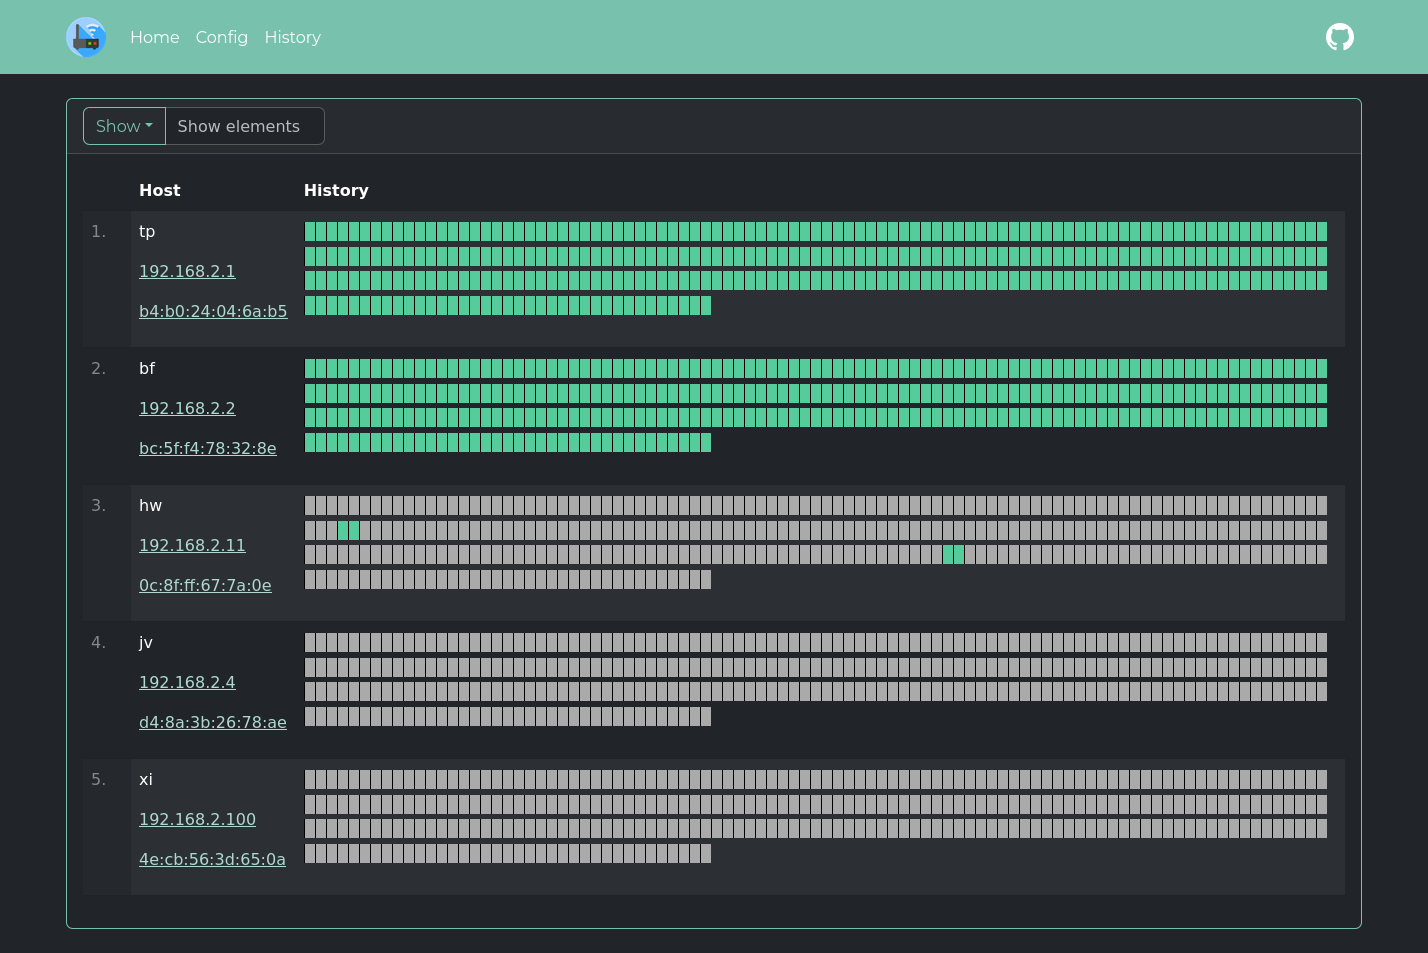
- Monitor hosts online/offline history
- Keep a list of all hosts in the network
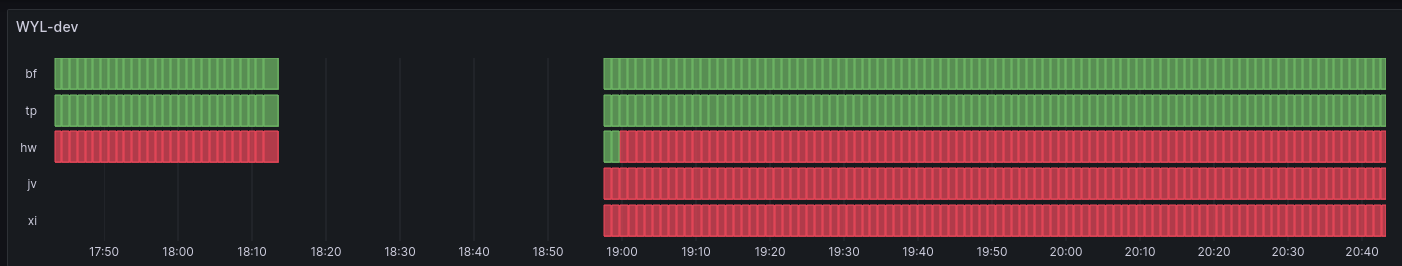
- Send data to `InfluxDB2` or `Prometheus` to make a `Grafana` dashboard
> [!IMPORTANT]
> Please, consider making a [donation](https://github.com/aceberg#donate). Even $10 will make a difference to me.
## More screenshots
<details>
<summary>Expand</summary>
</details>
## Quick start
<details>
<summary>Expand</summary>
Replace `$YOURTIMEZONE` with correct time zone and `$YOURIFACE` with network interface you want to scan. Network mode must be `host`. Set `$DOCKERDATAPATH` for container to save data:
```sh
docker run --name wyl \
-e "IFACES=$YOURIFACE" \
-e "TZ=$YOURTIMEZONE" \
--network="host" \
-v $DOCKERDATAPATH/wyl:/data/WatchYourLAN \
aceberg/watchyourlan
```
Web GUI should be at http://localhost:8840
</details>
## Auth
<details>
<summary>Expand</summary>
**WatchYourLAN** does not have built-in auth option. But you can use it with SSO tools like Authelia, or my simple auth app [ForAuth](https://github.com/aceberg/ForAuth).
Here is an example [docker-compose-auth.yml](https://github.com/aceberg/WatchYourLAN/blob/main/docker-compose-auth.yml).
> :warning: **WARNING!**
> Please, don't forget that WYL needs `host` network mode to work. So, WYL port will be exposed in this setup. You need to limit access to it with firewall or other measures.
</details>
## Install on Linux
<details>
<summary>Expand</summary>
All binary packages can be found in [latest](https://github.com/aceberg/WatchYourLAN/releases/latest) release. There are `.deb`, `.rpm`, `.apk` (Alpine Linux) and `.tar.gz` files.
Supported architectures: `amd64`, `i386`, `arm_v5`, `arm_v6`, `arm_v7`, `arm64`.
Dependencies: `arp-scan`, `tzdata`.
For `amd64` there is a `deb` repo [available](https://github.com/aceberg/ppa)
</details>
## Config
<details>
<summary>Expand</summary>
Configuration can be done through config file, GUI or environment variables. Variable names is `config_v2.yaml` file are the same, but in lowcase.
### Basic config
| Variable | Description | Default |
| -------- | ----------- | ------- |
| TZ | Set your timezone for correct time | |
| HOST | Listen address | 0.0.0.0 |
| PORT | Port for web GUI | 8840 |
| THEME | Any theme name from https://bootswatch.com in lowcase or [additional](https://github.com/aceberg/aceberg-bootswatch-fork) | sand |
| COLOR | Background color: light or dark | dark |
| NODEPATH | Path to local node modules | |
| SHOUTRRR_URL | WatchYourLAN uses [Shoutrrr](https://github.com/nicholas-fedor/shoutrrr) to send notifications. It is already integrated, just needs a correct URL. Examples for Discord, Email, Gotify, Matrix, Ntfy, Pushover, Slack, Telegram, Generic Webhook and etc are [here](https://nicholas-fedor.github.io/shoutrrr/) | |
### Scan settings
| Variable | Description | Default |
| -------- | ----------- | ------- |
| IFACES | Interfaces to scan. Could be one or more, separated by space. See [docs/VLAN_ARP_SCAN.md](https://github.com/aceberg/WatchYourLAN/blob/main/docs/VLAN_ARP_SCAN.md). | |
| TIMEOUT | Time between scans (seconds) | 120 |
| ARP_ARGS | Arguments for `arp-scan`. Enable `debug` log level to see resulting command. (Example: `-r 1`). See [docs/VLAN_ARP_SCAN.md](https://github.com/aceberg/WatchYourLAN/blob/main/docs/VLAN_ARP_SCAN.md). | |
| ARP_STRS ARP_STRS_JOINED | See [docs/VLAN_ARP_SCAN.md](https://github.com/aceberg/WatchYourLAN/blob/main/docs/VLAN_ARP_SCAN.md). | |
| LOG_LEVEL | Log level: `debug`, `info`, `warn` or `error` | info |
| TRIM_HIST | Remove history after (hours) | 48 |
| HIST_IN_DB | DEPRECATED since 2.1.3. Now History is always stored in DB. Use TRIM_HIST to reduce DB size | |
| USE_DB | Either `sqlite` or `postgres` | sqlite |
| PG_CONNECT | Address to connect to PostgreSQL. (Example: `postgres://username:
[email protected]:5432/dbname?sslmode=disable`). Full list of URL parameters [here](https://pkg.go.dev/github.com/lib/pq#hdr-Connection_String_Parameters) | |
### InfluxDB2 config
This config matches Grafana's config for InfluxDB data source
| Variable | Description | Default | Example |
| -------- | ----------- | ------- | ------- |
| INFLUX_ENABLE | Enable export to InfluxDB2 | false | true |
| INFLUX_SKIP_TLS | Skip TLS Verify | false | true |
| INFLUX_ADDR | Address:port of InfluxDB2 server | | https://192.168.2.3:8086/ |
| INFLUX_BUCKET | InfluxDB2 bucket | | test |
| INFLUX_ORG | InfluxDB2 org | | home |
| INFLUX_TOKEN | Secret token, generated by InfluxDB2 | | |
### Prometheus config
This config configures the Prometheus data source
| Variable | Description | Default | Example |
| -------- | ----------- | ------- | ------- |
| PROMETHEUS_ENABLE | Enable the Prometheus `/metrics` endpoint | false | true |
</details>
## Config file
<details>
<summary>Expand</summary>
Config file name is `config_v2.yaml`. Example:
```yaml
arp_args: ""
color: dark
host: 0.0.0.0
ifaces: enp4s0
influx_addr: ""
influx_bucket: ""
influx_enable: false
influx_org: ""
influx_skip_tls: false
influx_token: ""
log_level: info
nodepath: ""
pg_connect: ""
port: "8840"
prometheus_enable: false
shoutrrr_url: "gotify://192.168.0.1:8083/AwQqpAae.rrl5Ob/?title=Unknown host detected&DisableTLS=yes"
theme: sand
timeout: 60
trim_hist: 48
use_db: sqlite
```
</details>
## Options
<details>
<summary>Expand</summary>
| Key | Description | Default |
| -------- | ----------- | ------- |
| -d | Path to config dir | /data/WatchYourLAN |
| -n | Path to node modules (see below) | |
</details>
## Local network only
<details>
<summary>Expand</summary>
By default, this app pulls themes, icons and fonts from the internet. But, in some cases, it may be useful to have an independent from global network setup. I created a separate [image](https://github.com/aceberg/my-dockerfiles/tree/main/node-bootstrap) with all necessary modules and fonts.
Run with Docker:
```sh
docker run --name node-bootstrap \
-p 8850:8850 \
aceberg/node-bootstrap
```
```sh
docker run --name wyl \
-e "IFACES=$YOURIFACE" \
-e "TZ=$YOURTIMEZONE" \
--network="host" \
-v $DOCKERDATAPATH/wyl:/data/WatchYourLAN \
aceberg/watchyourlan -n "http://$YOUR_IP:8850"
```
Or use [docker-compose](docker-compose.yml)
</details>
## API & Integrations
<details>
<summary>Expand</summary>
### API
Moved to [docs/API.md](https://github.com/aceberg/WatchYourLAN/blob/main/docs/API.md)
### Integrations
- [ArchLinux (AUR)](https://aur.archlinux.org/packages/watch-your-lan) by `gilcu3`
- [Python API client](https://github.com/drwahl/py-watchyourlanclient) by [drwahl](https://github.com/drwahl)
- [Umbrel](https://apps.umbrel.com/app/watch-your-lan) by [Jasper](https://github.com/ceramicwhite)
- [YunoHost](https://apps.yunohost.org/app/watchyourlan)
</details>
## Thanks
<details>
<summary>Expand</summary>
- All go packages listed in [dependencies](https://github.com/aceberg/WatchYourLAN/network/dependencies)
- Favicon and logo: [Access point icons created by Freepik - Flaticon](https://www.flaticon.com/free-icons/access-point)
- [Bootstrap](https://getbootstrap.com/)
- Themes: [Free themes for Bootstrap](https://bootswatch.com)
</details>
", Assign "at most 3 tags" to the expected json: {"id":"11642","tags":[]} "only from the tags list I provide: [{"id":77,"name":"3d"},{"id":89,"name":"agent"},{"id":17,"name":"ai"},{"id":54,"name":"algorithm"},{"id":24,"name":"api"},{"id":44,"name":"authentication"},{"id":3,"name":"aws"},{"id":27,"name":"backend"},{"id":60,"name":"benchmark"},{"id":72,"name":"best-practices"},{"id":39,"name":"bitcoin"},{"id":37,"name":"blockchain"},{"id":1,"name":"blog"},{"id":45,"name":"bundler"},{"id":58,"name":"cache"},{"id":21,"name":"chat"},{"id":49,"name":"cicd"},{"id":4,"name":"cli"},{"id":64,"name":"cloud-native"},{"id":48,"name":"cms"},{"id":61,"name":"compiler"},{"id":68,"name":"containerization"},{"id":92,"name":"crm"},{"id":34,"name":"data"},{"id":47,"name":"database"},{"id":8,"name":"declarative-gui "},{"id":9,"name":"deploy-tool"},{"id":53,"name":"desktop-app"},{"id":6,"name":"dev-exp-lib"},{"id":59,"name":"dev-tool"},{"id":13,"name":"ecommerce"},{"id":26,"name":"editor"},{"id":66,"name":"emulator"},{"id":62,"name":"filesystem"},{"id":80,"name":"finance"},{"id":15,"name":"firmware"},{"id":73,"name":"for-fun"},{"id":2,"name":"framework"},{"id":11,"name":"frontend"},{"id":22,"name":"game"},{"id":81,"name":"game-engine "},{"id":23,"name":"graphql"},{"id":84,"name":"gui"},{"id":91,"name":"http"},{"id":5,"name":"http-client"},{"id":51,"name":"iac"},{"id":30,"name":"ide"},{"id":78,"name":"iot"},{"id":40,"name":"json"},{"id":83,"name":"julian"},{"id":38,"name":"k8s"},{"id":31,"name":"language"},{"id":10,"name":"learning-resource"},{"id":33,"name":"lib"},{"id":41,"name":"linter"},{"id":28,"name":"lms"},{"id":16,"name":"logging"},{"id":76,"name":"low-code"},{"id":90,"name":"message-queue"},{"id":42,"name":"mobile-app"},{"id":18,"name":"monitoring"},{"id":36,"name":"networking"},{"id":7,"name":"node-version"},{"id":55,"name":"nosql"},{"id":57,"name":"observability"},{"id":46,"name":"orm"},{"id":52,"name":"os"},{"id":14,"name":"parser"},{"id":74,"name":"react"},{"id":82,"name":"real-time"},{"id":56,"name":"robot"},{"id":65,"name":"runtime"},{"id":32,"name":"sdk"},{"id":71,"name":"search"},{"id":63,"name":"secrets"},{"id":25,"name":"security"},{"id":85,"name":"server"},{"id":86,"name":"serverless"},{"id":70,"name":"storage"},{"id":75,"name":"system-design"},{"id":79,"name":"terminal"},{"id":29,"name":"testing"},{"id":12,"name":"ui"},{"id":50,"name":"ux"},{"id":88,"name":"video"},{"id":20,"name":"web-app"},{"id":35,"name":"web-server"},{"id":43,"name":"webassembly"},{"id":69,"name":"workflow"},{"id":87,"name":"yaml"}]" returns me the "expected json"