base on Tool for shell commands execution, visualization and alerting. Configured with a simple YAML file. # Sampler. Visualization for any shell command.
[](https://travis-ci.com/sqshq/sampler) [](https://goreportcard.com/report/github.com/sqshq/sampler)
Sampler is a tool for shell commands execution, visualization and alerting. Configured with a simple YAML file.
## Why do I need it?
One can sample any dynamic process right from the terminal — observe changes in the database, monitor MQ in-flight messages, trigger a deployment script and get notification when it's done.
If there is a way to get a metric using a shell command, then it can be visualized with Sampler momentarily.
## Installation
### macOS
[HomeBrew](https://brew.sh):
```bash
brew install sampler
```
[MacPorts](https://www.macports.org):
```bash
sudo port install sampler
```
or
```bash
sudo curl -Lo /usr/local/bin/sampler https://github.com/sqshq/sampler/releases/download/v1.1.0/sampler-1.1.0-darwin-amd64
sudo chmod +x /usr/local/bin/sampler
```
### Linux
```bash
sudo wget https://github.com/sqshq/sampler/releases/download/v1.1.0/sampler-1.1.0-linux-amd64 -O /usr/local/bin/sampler
sudo chmod +x /usr/local/bin/sampler
```
Note: `libasound2-dev` system library is required to be installed for Sampler to play a [trigger](https://github.com/sqshq/sampler#triggers) sound tone. Usually the library is in place, but if not - you can install it with your favorite package manager, e.g `apt install libasound2-dev`
#### Packaging status
- [Fedora](https://apps.fedoraproject.org/packages/golang-github-sqshq-sampler) `sudo dnf install golang-github-sqshq-sampler` (F31+)
- [Arch](https://aur.archlinux.org/packages/sampler) `yay -S sampler`
### Windows (experimental)
Recommended to use with advanced console emulators, e.g. [Cmder](https://cmder.app/)
Via [Chocolatey](https://chocolatey.org/docs)
```powershell
choco install sampler
```
or
[Download .exe](https://github.com/sqshq/sampler/releases/download/v1.1.0/sampler-1.1.0-windows-amd64.exe)
### Docker
```
# Create a configuration file
vim config.yml
# Build the container image
docker build --tag sampler .
# Run a container
docker run --interactive --tty --volume $(pwd)/config.yml:/root/config.yml sampler --config /root/config.yml
```
## Usage
You specify shell commands, Sampler executes them with a required rate. The output is used for visualization.
Using Sampler is basically a 3-step process:
- Define your shell commands in a YAML configuration file
- Run `sampler -c config.yml`
- Adjust components size and location on UI
## But there are so many monitoring systems already
Sampler is by no means an alternative to full-scale monitoring systems, but rather an easy to setup development tool.
If spinning up and configuring [Prometheus with Grafana](https://prometheus.io) is complete overkill for you task, Sampler might be the right solution. No servers, no databases, no deploy - you specify shell commands, and it just works.
## Then it should be installed on every server I monitor?
No, you can run Sampler on local, but still gather telemetry from multiple remote machines. Any visualization might have `init` command, where you can ssh to a remote server. See the [SSH example](https://github.com/sqshq/sampler#ssh)
## Contents
- [Components](#components)
- [Runchart](#runchart)
- [Sparkline](#sparkline)
- [Barchart](#barchart)
- [Gauge](#gauge)
- [Textbox](#textbox)
- [Asciibox](#asciibox)
- [Bells and whistles](#bells-and-whistles)
- [Triggers (conditional actions)](#triggers)
- [Interactive shell (database interaction, remote server access, etc)](#interactive-shell-support)
- [Variables](#variables)
- [Color theme](#color-theme)
- [Real-world recipes (contributions welcome!)](#real-world-recipes)
- [Databases (MySQL, PostgreSQL, MongoDB, Neo4j)](#databases)
- [Kafka](#kafka)
- [Docker](#docker)
- [SSH](#ssh)
- [JMX](#jmx)
## Components
The following is a list of configuration examples for each component type, with macOS compatible sampling scripts.
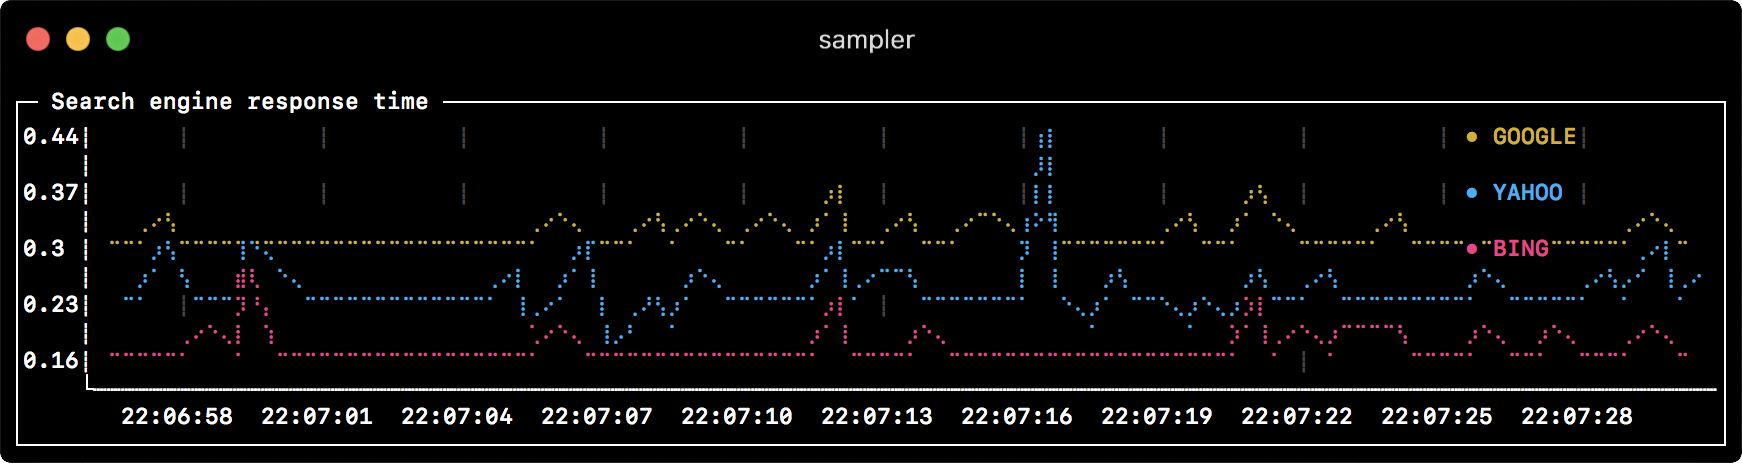
### Runchart
```yml
runcharts:
- title: Search engine response time
rate-ms: 500 # sampling rate, default = 1000
scale: 2 # number of digits after sample decimal point, default = 1
legend:
enabled: true # enables item labels, default = true
details: false # enables item statistics: cur/min/max/dlt values, default = true
items:
- label: GOOGLE
sample: curl -o /dev/null -s -w '%{time_total}' https://www.google.com
color: 178 # 8-bit color number, default one is chosen from a pre-defined palette
- label: YAHOO
sample: curl -o /dev/null -s -w '%{time_total}' https://search.yahoo.com
- label: BING
sample: curl -o /dev/null -s -w '%{time_total}' https://www.bing.com
```
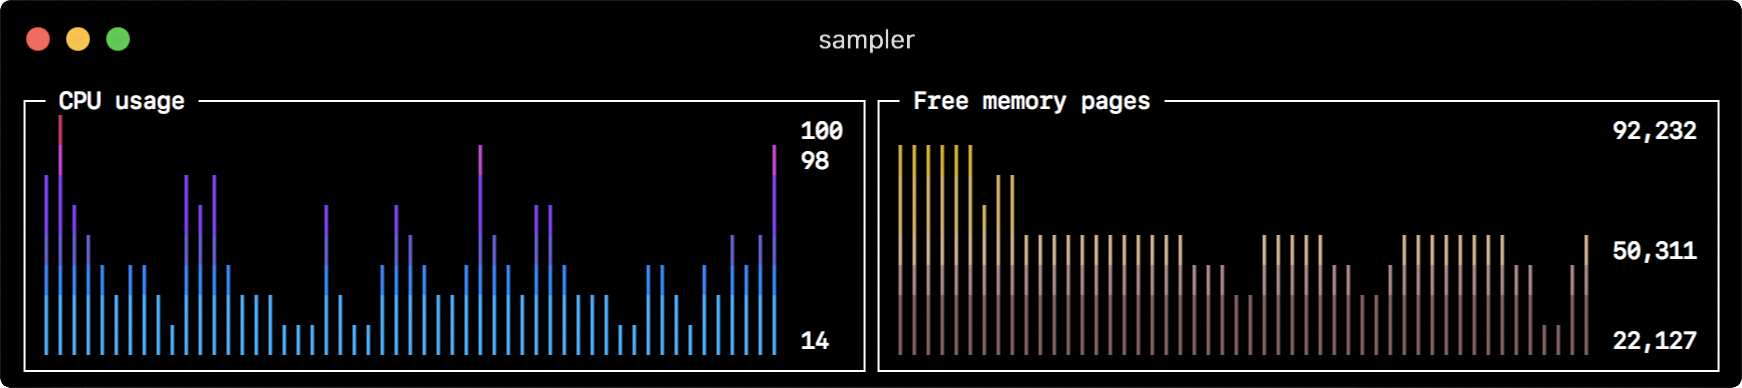
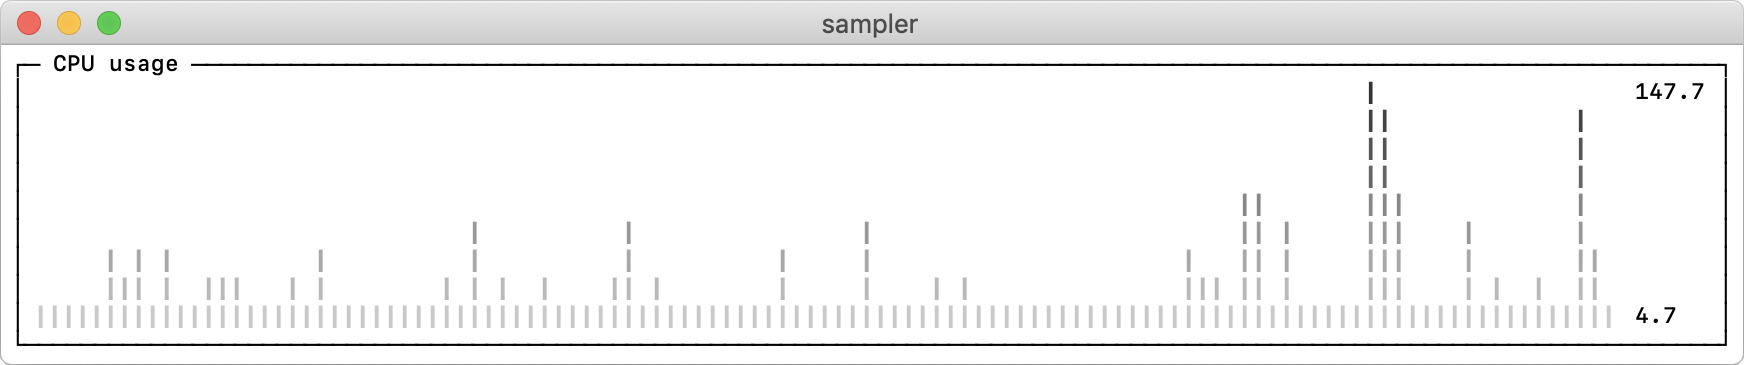
### Sparkline
```yml
sparklines:
- title: CPU usage
rate-ms: 200
scale: 0
sample: ps -A -o %cpu | awk '{s+=$1} END {print s}'
- title: Free memory pages
rate-ms: 200
scale: 0
sample: memory_pressure | grep 'Pages free' | awk '{print $3}'
```
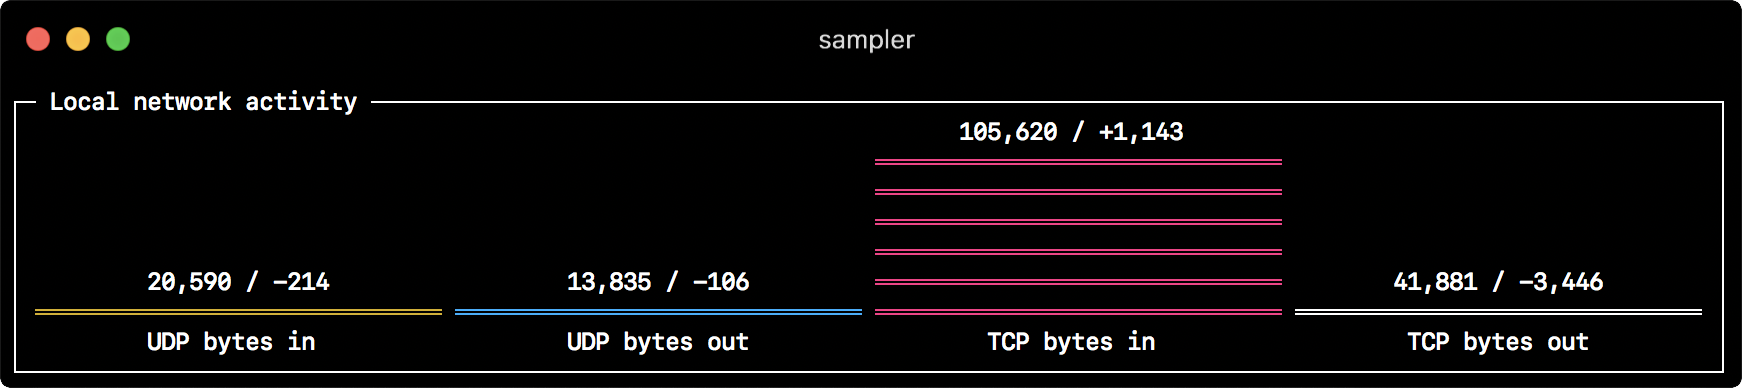
### Barchart
```yml
barcharts:
- title: Local network activity
rate-ms: 500 # sampling rate, default = 1000
scale: 0 # number of digits after sample decimal point, default = 1
items:
- label: UDP bytes in
sample: nettop -J bytes_in -l 1 -m udp | awk '{sum += $4} END {print sum}'
- label: UDP bytes out
sample: nettop -J bytes_out -l 1 -m udp | awk '{sum += $4} END {print sum}'
- label: TCP bytes in
sample: nettop -J bytes_in -l 1 -m tcp | awk '{sum += $4} END {print sum}'
- label: TCP bytes out
sample: nettop -J bytes_out -l 1 -m tcp | awk '{sum += $4} END {print sum}'
```
### Gauge
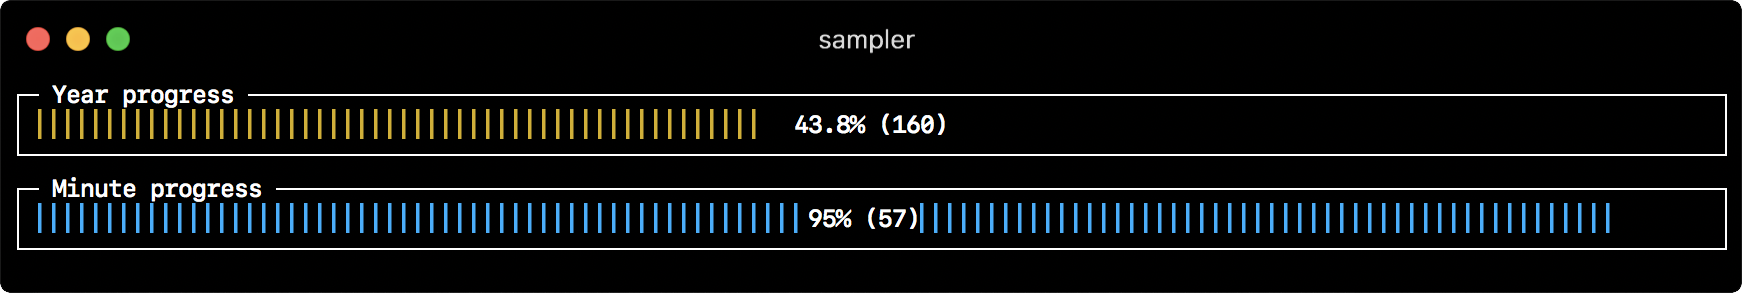
```yml
gauges:
- title: Minute progress
rate-ms: 500 # sampling rate, default = 1000
scale: 2 # number of digits after sample decimal point, default = 1
percent-only: false # toggle display of the current value, default = false
color: 178 # 8-bit color number, default one is chosen from a pre-defined palette
cur:
sample: date +%S # sample script for current value
max:
sample: echo 60 # sample script for max value
min:
sample: echo 0 # sample script for min value
- title: Year progress
cur:
sample: date +%j
max:
sample: echo 365
min:
sample: echo 0
```
### Textbox
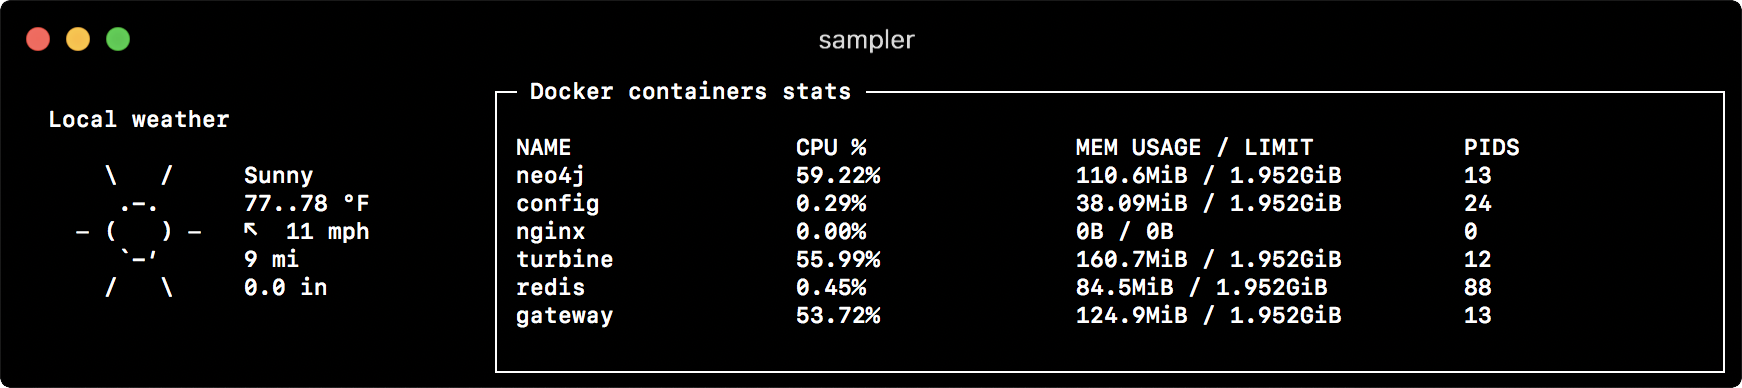
```yml
textboxes:
- title: Local weather
rate-ms: 10000 # sampling rate, default = 1000
sample: curl wttr.in?0ATQF
border: false # border around the item, default = true
color: 178 # 8-bit color number, default is white
- title: Docker containers stats
rate-ms: 500
sample: docker stats --no-stream --format "table {{.Name}}\t{{.CPUPerc}}\t{{.MemUsage}}\t{{.PIDs}}"
```
### Asciibox

```yml
asciiboxes:
- title: UTC time
rate-ms: 500 # sampling rate, default = 1000
font: 3d # font type, default = 2d
border: false # border around the item, default = true
color: 43 # 8-bit color number, default is white
sample: env TZ=UTC date +%r
```
## Bells and whistles
### Triggers
Triggers allow to perform conditional actions, like visual/sound alerts or an arbitrary shell command.
The following examples illustrate the concept.
#### Clock gauge, which shows minute progress and announces current time at the beginning of each minute
```yml
gauges:
- title: MINUTE PROGRESS
position: [[0, 18], [80, 0]]
cur:
sample: date +%S
max:
sample: echo 60
min:
sample: echo 0
triggers:
- title: CLOCK BELL EVERY MINUTE
condition: '[ $label == "cur" ] && [ $cur -eq 0 ] && echo 1 || echo 0' # expects "1" as TRUE indicator
actions:
terminal-bell: true # standard terminal bell, default = false
sound: true # NASA quindar tone, default = false
visual: false # notification with current value on top of the component area, default = false
script: say -v samantha `date +%I:%M%p` # an arbitrary script, which can use $cur, $prev and $label variables
```
#### Search engine latency chart, which alerts user when latency exceeds a threshold
```yml
runcharts:
- title: SEARCH ENGINE RESPONSE TIME (sec)
rate-ms: 200
items:
- label: GOOGLE
sample: curl -o /dev/null -s -w '%{time_total}' https://www.google.com
- label: YAHOO
sample: curl -o /dev/null -s -w '%{time_total}' https://search.yahoo.com
triggers:
- title: Latency threshold exceeded
condition: echo "$prev < 0.3 && $cur > 0.3" |bc -l # expects "1" as TRUE indicator
actions:
terminal-bell: true # standard terminal bell, default = false
sound: true # NASA quindar tone, default = false
visual: true # visual notification on top of the component area, default = false
script: 'say alert: ${label} latency exceeded ${cur} second' # an arbitrary script, which can use $cur, $prev and $label variables
```
### Interactive shell support
In addition to the `sample` command, one can specify `init` command (executed only once before sampling) and `transform` command (to post-process `sample` command output). That covers interactive shell use case, e.g. to establish connection to a database only once, and then perform polling within interactive shell session.
#### Basic mode
```yml
textboxes:
- title: MongoDB polling
rate-ms: 500
init: mongo --quiet --host=localhost test # executes only once to start the interactive session
sample: Date.now(); # executes with a required rate, in scope of the interactive session
transform: echo result = $sample # executes in scope of local session, $sample variable is available for transformation
```
#### PTY mode
In some cases interactive shell won't work, because its stdin is not a terminal. We can fool it, using PTY mode:
```yml
textboxes:
- title: Neo4j polling
pty: true # enables pseudo-terminal mode, default = false
init: cypher-shell -u neo4j -p pwd --format plain
sample: RETURN rand();
transform: echo "$sample" | tail -n 1
- title: Top on a remote server
pty: true # enables pseudo-terminal mode, default = false
init: ssh -i ~/user.pem
[email protected]
sample: top
```
#### Multistep init
It is also possible to execute multiple init commands one after another, before you start sampling.
```yml
textboxes:
- title: Java application uptime
multistep-init:
- java -jar jmxterm-1.0.0-uber.jar
- open host:port # or local PID
- bean java.lang:type=Runtime
sample: get Uptime
```
### Variables
If the configuration file contains repeated patterns, they can be extracted into the `variables` section.
Also variables can be specified using `-v`/`--variable` flag on startup, and any system environment variables will also be available in the scripts.
```yml
variables:
mongoconnection: mongo --quiet --host=localhost test
barcharts:
- title: MongoDB documents by status
items:
- label: IN_PROGRESS
init: $mongoconnection
sample: db.getCollection('events').find({status:'IN_PROGRESS'}).count()
- label: SUCCESS
init: $mongoconnection
sample: db.getCollection('events').find({status:'SUCCESS'}).count()
- label: FAIL
init: $mongoconnection
sample: db.getCollection('events').find({status:'FAIL'}).count()
```
### Color theme
```yml
theme: light # default = dark
sparklines:
- title: CPU usage
sample: ps -A -o %cpu | awk '{s+=$1} END {print s}'
```
## Real-world recipes
### Databases
The following are different database connection examples. Interactive shell (init script) usage is recommended to establish connection only once and then reuse it during sampling.
<details><summary>MySQL</summary>
```yml
# prerequisite: installed mysql shell
variables:
mysql_connection: mysql -u root -s --database mysql --skip-column-names
sparklines:
- title: MySQL (random number example)
pty: true
init: $mysql_connection
sample: select rand();
```
</details>
<details><summary>PostgreSQL</summary>
```yml
# prerequisite: installed psql shell
variables:
PGPASSWORD: pwd
postgres_connection: psql -h localhost -U postgres --no-align --tuples-only
sparklines:
- title: PostgreSQL (random number example)
init: $postgres_connection
sample: select random();
```
</details>
<details><summary>MongoDB</summary>
```yml
# prerequisite: installed mongo shell
variables:
mongo_connection: mongo --quiet --host=localhost test
sparklines:
- title: MongoDB (random number example)
init: $mongo_connection
sample: Math.random();
```
</details>
<details><summary>Neo4j</summary>
```yml
# prerequisite: installed cypher shell
variables:
neo4j_connection: cypher-shell -u neo4j -p pwd --format plain
sparklines:
- title: Neo4j (random number example)
pty: true
init: $neo4j_connection
sample: RETURN rand();
transform: echo "$sample" | tail -n 1
```
</details>
### Kafka
<details><summary>Kafka lag per consumer group</summary>
```yml
variables:
kafka_connection: $KAFKA_HOME/bin/kafka-consumer-groups --bootstrap-server localhost:9092
runcharts:
- title: Kafka lag per consumer group
rate-ms: 5000
scale: 0
items:
- label: A->B
sample: $kafka_connection --group group_a --describe | awk 'NR>1 {sum += $5} END {print sum}'
- label: B->C
sample: $kafka_connection --group group_b --describe | awk 'NR>1 {sum += $5} END {print sum}'
- label: C->D
sample: $kafka_connection --group group_c --describe | awk 'NR>1 {sum += $5} END {print sum}'
```
</details>
### Docker
<details><summary>Docker containers stats (CPU, MEM, O/I)</summary>
```yml
textboxes:
- title: Docker containers stats
sample: docker stats --no-stream --format "table {{.Name}}\t{{.CPUPerc}}\t{{.MemPerc}}\t{{.MemUsage}}\t{{.NetIO}}\t{{.BlockIO}}\t{{.PIDs}}"
```
</details>
### SSH
<details><summary>TOP command on a remote server</summary>
```yml
variables:
sshconnection: ssh -i ~/my-key-pair.pem
[email protected]
textboxes:
- title: SSH
pty: true
init: $sshconnection
sample: top
```
</details>
### JMX
<details><summary>Java application uptime example</summary>
```yml
# prerequisite: download [jmxterm jar file](https://docs.cyclopsgroup.org/jmxterm)
textboxes:
- title: Java application uptime
multistep-init:
- java -jar jmxterm-1.0.0-uber.jar
- open host:port # or local PID
- bean java.lang:type=Runtime
sample: get Uptime
transform: echo $sample | tr -dc '0-9' | awk '{printf "%.1f min", $1/1000/60}'
```
</details>
", Assign "at most 3 tags" to the expected json: {"id":"12309","tags":[]} "only from the tags list I provide: []" returns me the "expected json"