AI prompts
base on Logging Made Easy (LME) is a no cost, open source platform that centralizes log collection, enhances threat detection, and enables real-time alerting, helping small to medium-sized organizations secure their infrastructure.
[]()
[]()
# Logging Made Easy
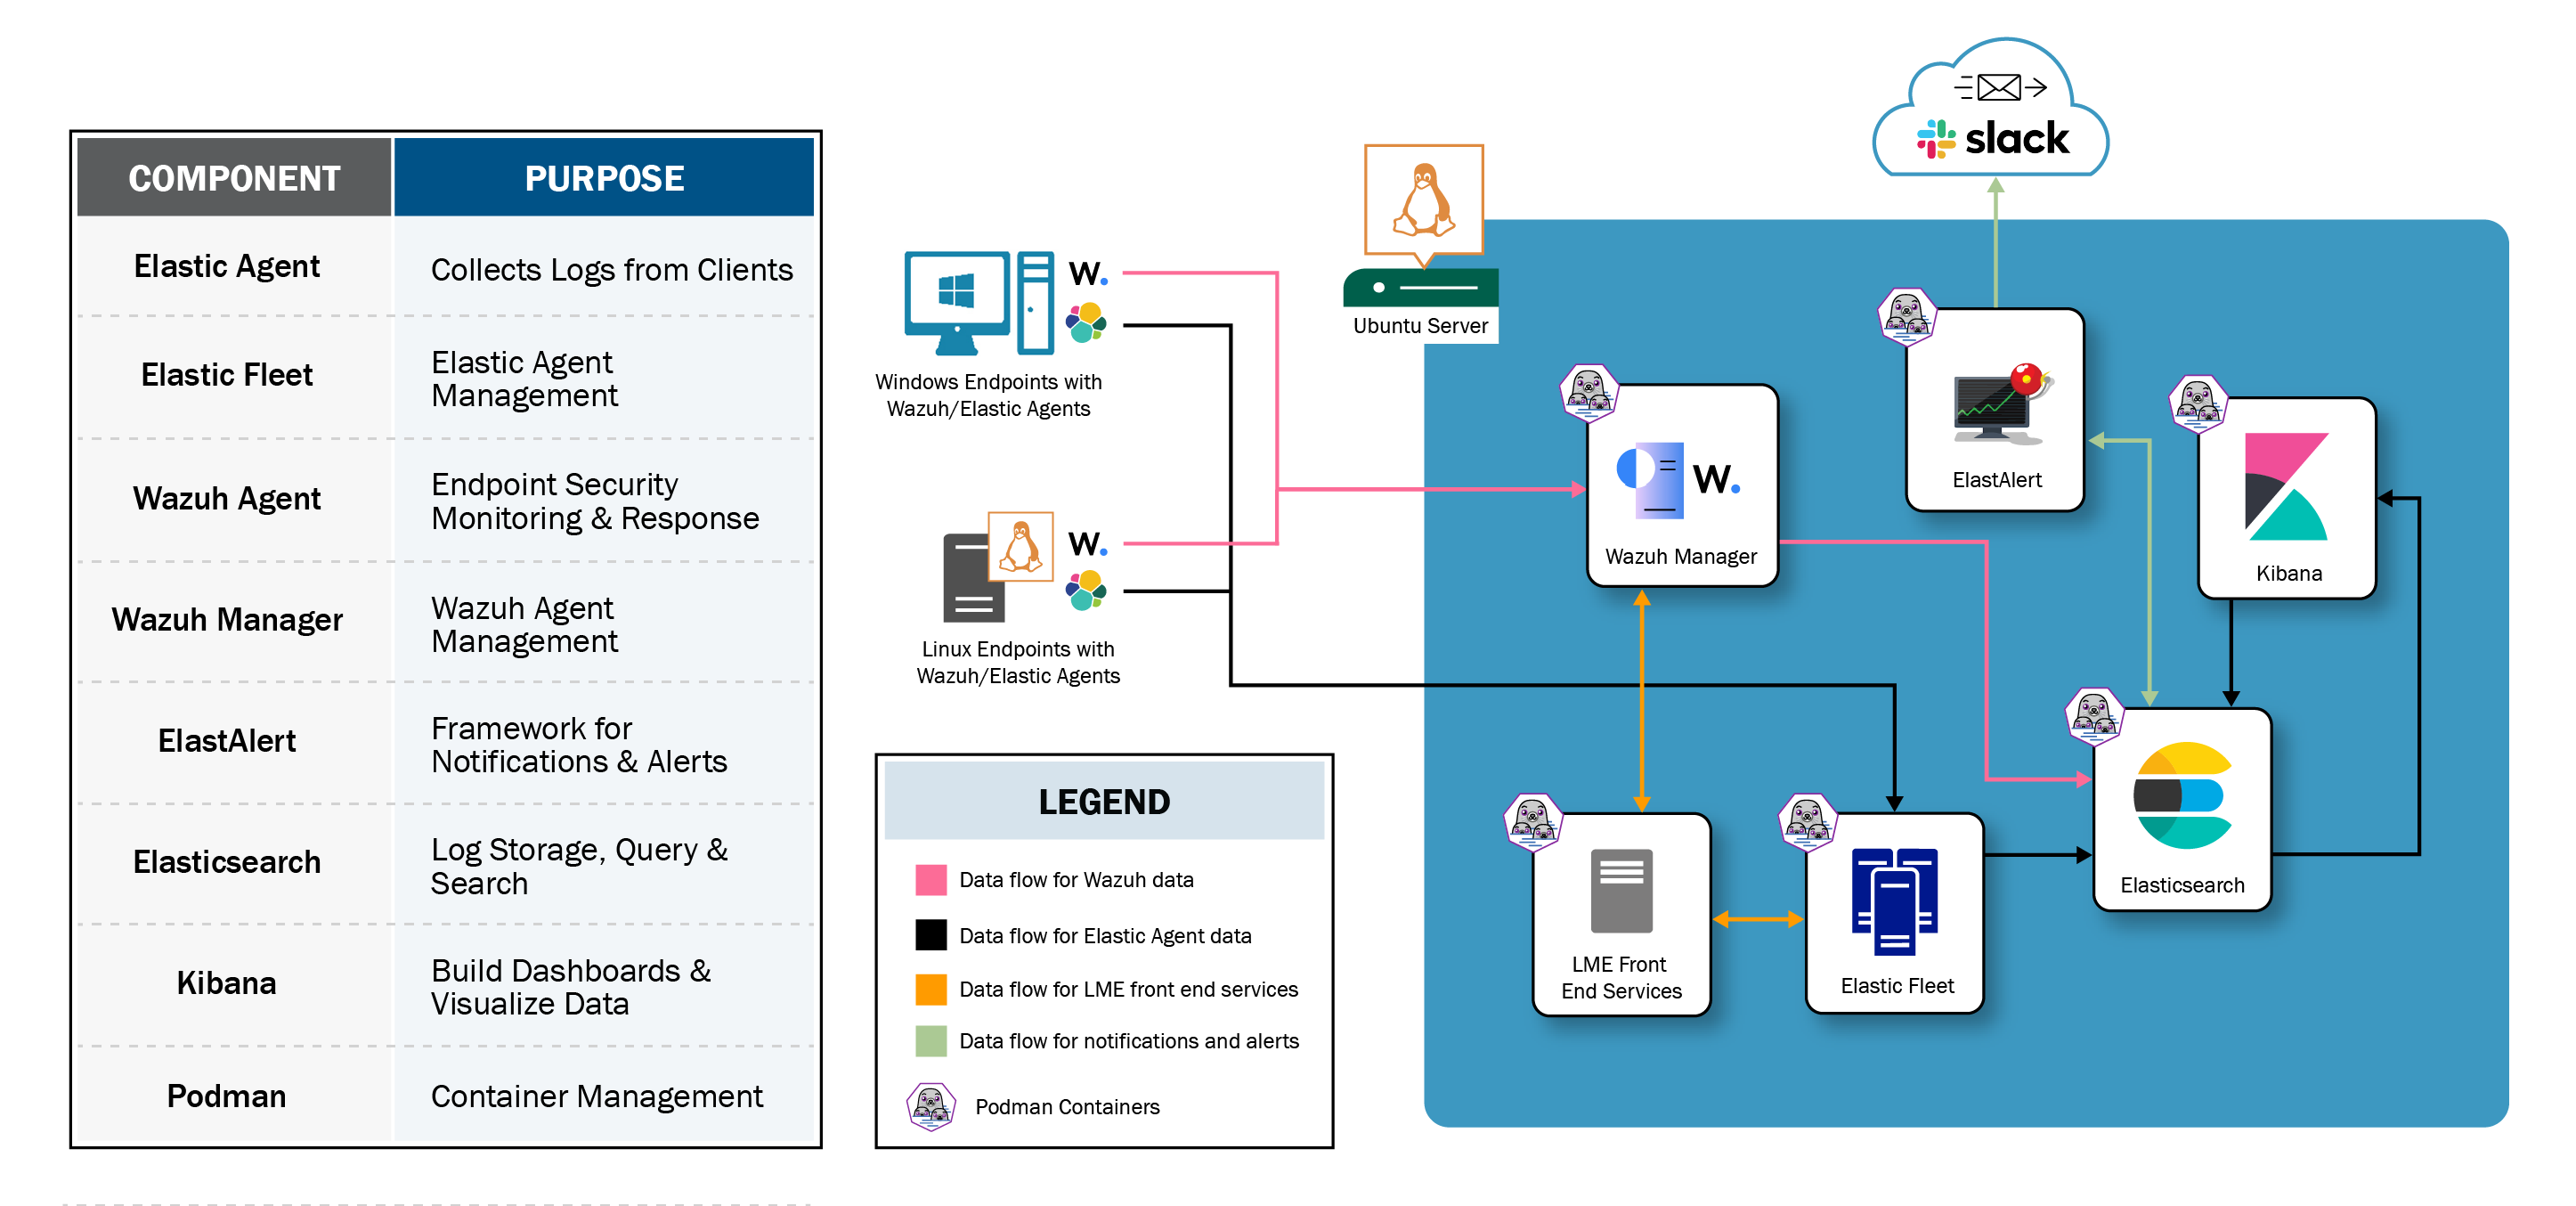
CISA's Logging Made Easy (LME) is a no cost, open source platform that centralizes log collection, enhances threat detection, and enables real-time alerting, helping small to medium-sized organizations secure their infrastructure. Whether you're upgrading from a previous version or deploying for the first time, LME offers a scalable, efficient solution for logging and endpoint security.
Check out the LME introduction video [here](https://www.youtube.com/watch?v=AZFV6ZOLg7s).
## Who is Logging Made Easy for?
From single IT administrators with a handful of devices in their network to small and medium-sized agencies. Really, for anyone!
LME is intended for organizations that:
- Need a log management and threat detection system.
- Do not have an existing Security Operations Center (SOC), Security Information and Event Management (SIEM) solution or log management and monitoring capabilities.
- Work within limited budgets, time or expertise to set up and manage a logging and threat detection system.
## Updates
For LME's 2.0 release, we’re introducing several new features and architectural components to improve Security Information and Event Management (SIEM) capabilities while simplifying overall use of LME:
- **Enhanced Threat Detection and Response**: Integrated Wazuh’s and Elastic's open-source tools, along with ElastAlert, for improved detection accuracy and real-time alerting.
- **Security by Design**: Introduced Podman containerization and encryption to meet the highest security standards.
- **Simplified Installation**: Added Ansible scripts to automate deployment for faster setup and easier maintenance.
- **Custom Data Visualization**: Design and customize dashboards with Kibana to meet specific monitoring needs.
- **Comprehensive Testing**: Expanded unit testing and threat emulation ensure system stability and reliability.
LME 2.0 is fully operational and built to deliver effective log management and threat detection. As part of our commitment to continuous improvement, future updates, including version 2.1, will introduce additional enhancements for scalability and deployment flexibility.
## Questions and Community Engagement:
We encourage users to connect and engage with the LME community via [GitHub Discussions](https://github.com/cisagov/lme/discussions).
If you’re troubleshooting your installation, be sure to utilize our [troubleshooting documentation](/docs/markdown/reference/troubleshooting.md).
If you have a question regarding LME (technical matters, installation issues, service bugs, etc.) or just general
questions, please utilize [GitHub Discussions](https://github.com/cisagov/lme/discussions). Before starting a new discussion, please take a moment to review previously submitted questions to determine if your inquiry has already been addressed. If it has not, feel free to submit a new discussion and the technical team will do their best to answer you in a timely fashion.
If you believe you have found a bug or issue with LME code or documentation, please submit a [GitHub issue](https://github.com/cisagov/lme/issues).
Please review current issues to see if the problem you are experiencing has been previously addressed or has an open issue.
If you would like to connect with the LME technical team in a 1:1 support session, please fill out
[this form](https://forms.office.com/g/CfecMqCvFN). In these sessions we can help users troubleshoot technical issues they are encountering
with their installation and receive feedback from users regarding the tool and improvements that
can be made. Please note that the availability of these sessions is dependent on the technical
team’s availability, and it may take a few weeks for us to reach out to you for scheduling.
### Share Your Feedback:
Your input is essential to the continuous improvement of LME and to ensure it best meets your needs. Take a few moments to complete our [LME Feedback Survey](https://cisasurvey.gov1.qualtrics.com/jfe/form/SV_dcbiVB58HTvJOhE). Together, we can improve LME's ability to secure your organization!
## Table of Contents:
1. [What is LME?](#1-what-is-lme)
2. [Prerequisites](#2-prerequisites)
3. [Downloading and Installing LME](#3-downloading-and-installing-lme)
1. [Downloading LME](#1-downloading-lme)
2. [Configuration](#2-configuration)
3. [Installation](#3-installation)
4. [Post-Installation Steps](#4-post-installation-steps)
5. [Deploying Agents](#5-deploying-agents)
6. [Installing Sysmon](#6-installing-sysmon-windows-clients-only)
4. [Next Steps](#4-next-steps)
1. [Retrieving Passwords](#retrieving-passwords)
2. [Starting and Stopping LME](#starting-and-stopping-lme)
3. [Uninstall LME](#uninstall-lme)
5. [Documentation](#5-documentation)
6. [Developer Notes](#6-developer-notes)
## 1. What is LME?
For more precise understanding of LME's architecture please see our [architecture documentation](/docs/markdown/reference/architecture.md).
### Description:
LME runs on Ubuntu 22.04 and 24.04. To execute services, LME leverages Podman containers for security, performance, and scalability.
We’ve integrated Wazuh, Elastic, and ElastAlert open source tools to provide log management, endpoint security monitoring, alerting, and data visualization capabilities.
This modular, flexible architecture supports efficient log storage, search, and threat detection, and enables you to scale as your logging needs evolve.
### How does LME work?:

Important pieces to understand from an LME user perspective:
1. **Collecting**: Logs are collected via agents
- **Wazuh Agents**: Enables Endpoint Detection and Response (EDR) on client systems, providing advanced security features like intrusion detection and anomaly detection. For more information, see [Wazuh's agent documentation](https://github.com/wazuh/wazuh-agent).
- **Elastic Agents**: Enhance log collection and management, allowing for greater control and customization in how data is collected and analyzed. Agents also feature a vast collection of integrations for many log types/applications. For more information, see [Elastic's agent documentation](https://github.com/elastic/elastic-agent).
2. **Viewing**: Logs are viewable in dashboards via kibana
- [Kibana](https://www.elastic.co/kibana) is the visualization and analytics interface in LME, providing users with tools to visualize and monitor log data stored in Elasticsearch. It enables the creation of custom dashboards and visualizations, allowing users to easily track security events, detect anomalies, and analyze trends. Kibana's intuitive interface supports real-time insights into the security posture of an organization, making it an essential tool for data-driven decision-making in LME’s centralized logging and security monitoring framework.
3. **Alerting**: Setting up notifications for log monitoring with Elastalert
- [ElastAlert](https://elastalert2.readthedocs.io/en/latest/index.html) is an open-source alerting framework, to automate alerting based on data stored in Elasticsearch. It monitors Elasticsearch for specific patterns, thresholds, or anomalies, and generates alerts when predefined conditions are met. This provides proactive detection of potential security incidents, enabling faster response and investigation. ElastAlert’s flexible rule system allows for custom alerts tailored to your organization’s security monitoring needs, making it a critical component of the LME alerting framework.
### What firewall rules do I need to setup?:
Please see our documentation around cloud and firewall setup for more information on how you can [expose these ports](/docs/markdown/logging-guidance/cloud.md).
Ports that need to be open on LME's server AND reachable by all clients from which you want to collect logs:
- Elasticsearch: *9200*
- Kibana: *443,5601*
- Wazuh: *1514,1515,1516,55000,514*
- Agent: *8220*
**Note**: For Kibana, 5601 is the default port. We've also set kibana to listen on 443 as well.
## 2. Prerequisites
If you're unsure whether you meet the prerequisites for installing LME, please refer to our [prerequisites documentation](/docs/markdown/prerequisites.md).
The main prerequisite is setting up hardware for your Ubuntu server, which should have at least:
- Two (2) processors
- 16GB RAM
- 128GB of dedicated storage for LME’s Elasticsearch database.
If you need to run LME with less than 16GB of RAM or minimal hardware, please follow our troubleshooting guide to configure Podman quadlets for reduced memory usage. We recommend setting Elasticsearch to an 8GB limit and Kibana to a 4GB limit. You can find the guide [here](/docs/markdown/reference/troubleshooting.md#memory-in-containers-need-more-ramless-ram-usage).
Ideally if your server is going to have hundreds of clients connecting to it, you will need far more resources dedicated to the LME instance, please see [our documentation for an expanded discussion around scaling LME](/docs/markdown/prerequisites.md#scaling-the-solution).
We estimate that you should allow half an hour to complete the entire installation process. The following time table of real recorded times will provide you a reference of how long the installation may take to complete.
### Estimated Installation Times
| Milestones | Time | Timeline |
| ------------- | ------------- | ------------- |
| Download LME | 0:31.49 | 0:31.49 |
| Set Environment | 0:35.94 | 1:06.61 |
| Install Ansible | 1:31.94 | 2:38.03 |
| Installing LME Ansible Playbook | 4:03.63 | 6:41.66 |
| All Containers Active | 6:41.66 | 13:08.92 |
| Accessing Elastic | 0:38.97 | 13:47.60 |
| Post-Install Ansible Playbook | 2:04.34 | 15:51.94 |
| Deploy Linux Elastic Agent | 0:49.95 | 16:41.45 |
| Deploy Windows Elastic Agent | 1:32.00 | 18:13.40 |
| Deploy Linux Wazuh Agent | 1:41.99 | 19:55.34 |
| Deploy Windows Wazuh Agent | 1:55.00 | 21:51.22 |
| Download LME Zip on Windows | 2:22.43 | 24:13.65 |
| Install Sysmon | 1:04.34 | 25:17.99 |
| Windows Integration | 0:39.93 | 25:57.27 |
## 3. Downloading and Installing LME
This guide provides step-by-step instructions for downloading, configuring, and installing LME on an Ubuntu server.
For visual learners, an LME installation video is also available [here](https://www.youtube.com/watch?v=LKD8sw6VuPw).
**Note:** LME has been extensively tested on Ubuntu 22.04. While it can run on other Unix-like systems, we recommend sticking with Ubuntu 22.04 for the best experience.
We have done initial testing on 24.04, and suggest using that if you run into issues setting up on 22.04.
**Upgrading**:
If you are upgrading from an older version of LME to LME 2.0, please see our [upgrade documentation](/docs/markdown/maintenance/upgrading.md).
### 1. Downloading LME
Follow these steps to download and set up LME:
#### 1.1 Update System Packages
Update your package list and install the necessary tools:
```bash
sudo apt update && sudo apt upgrade -y
```
#### 1.2 Install Prerequisites
Install the required tools including Ansible:
```bash
sudo apt install curl jq unzip ansible -y
```
#### 1.3 Download and Extract LME
Download the latest release of LME and extract it to `~/LME`:
```bash
curl -s https://api.github.com/repos/cisagov/LME/releases/latest | jq -r '.assets[0].browser_download_url' | xargs -I {} sh -c 'curl -L -O {} && unzip -d ~/LME $(basename {})'
```
### 2. Configuration
Configure LME by following these steps:
#### 2.1 Retrieve Server IP Address
Obtain your server's IP address, which will be used by clients to forward logs:
```bash
hostname -I | awk '{print $1}'
```
#### 2.2 Set Up Environment Variables
Navigate to the LME directory:
```bash
cd ~/LME
```
Copy the example environment file:
```bash
cp ./config/example.env ./config/lme-environment.env
```
Edit the `lme-environment.env` file to update the `IPVAR` variable with your server's IP address:
```shell
IPVAR=127.0.0.1 # Replace with your server's IP address
```
For example, open and edit the file via nano:
```bash
nano ./config/lme-environment.env
```
### 3. Installation
Install LME by following these steps:
#### 3.1 Execute the Installation Playbook
Run the Ansible playbook from within your LME directory to install LME:
```bash
ansible-playbook ./ansible/install_lme_local.yml
```
<span style="color:orange">**Note**: The services may take a few minutes to start. Please be patient.</span>
#### 3.2 Verify Container Status
Check that the containers are running and healthy:
```bash
sudo -i podman ps --format "{{.Names}} {{.Status}}"
```
Expected output:
```shell
lme-elasticsearch Up 19 hours (healthy)
lme-wazuh-manager Up 19 hours
lme-kibana Up 19 hours (healthy)
lme-elastalert2 Up 17 hours
```
**Note**: Fleet server will only run after the post-installation script
**Note:** If the output differs, refer to the [troubleshooting guide](/docs/markdown/reference/troubleshooting.md#installation-troubleshooting).
Proceed to Post-Installation steps.
### 4. Post-Installation Steps
If you encounter any issues, refer to the post-installation [troubleshooting guide](/docs/markdown/reference/troubleshooting.md#post-installation-troubleshooting).
#### 4.1 Execute the Post-Installation Playbook
Run the post-installation playbook:
```bash
ansible-playbook ./ansible/post_install_local.yml
```
<span style="color:red">**Important**: The post-install script sets up the password for a `readonly_user` account, intended for analysts who need to query Elasticsearch without administrative access. The script will output the password at the end. Ensure you save this password securely.</span>
Example output:
```bash
TASK [DISPLAY NEW READONLY USER PASSWORD] ***************************************************************************************************************************************
ok: [localhost] => {
"msg": "LOGIN WITH readonly_user via:\n USER: readonlyuser\nPassword: oz9vLny0fB3HA8S2hH!FLZ06TvpaCq"
}
PLAY RECAP **********************************************************************************************************************************************************************
localhost : ok=27 changed=6 unreachable=0 failed=0 skipped=3 rescued=0 ignored=0
```
<span style="color:orange">**Note:** The password for the `readonly_user` will change each time this script is run. Run this script only when necessary, ideally just once.</span>
#### 4.2 Verify Container Status
Check that the containers are running and healthy:
```bash
sudo -i podman ps --format "{{.Names}} {{.Status}}"
```
Expected output:
```shell
lme-elasticsearch Up 29 minutes (healthy)
lme-elastalert2 Up 29 minutes
lme-wazuh-manager Up 29 minutes (healthy)
lme-kibana Up 29 minutes (healthy)
lme-fleet-server Up 26 minutes
```
### 5. Deploying Agents
To populate the dashboards with data, you need to install agents. Detailed guides for deploying Wazuh and Elastic agents are available in the following documents:
- [Deploy Wazuh Agent](/docs/markdown/agents/wazuh-agent-management.md)
- [Deploying Elastic-Agent](/docs/markdown/agents/elastic-agent-management.md)
### 6. Installing Sysmon (Windows Clients Only)
For Windows clients, installing Sysmon is essential to obtain comprehensive logs and ensure proper data visualization in the dashboards. Follow these steps to install Sysmon on each Windows client machine:
1. Download and unzip the LME folder on the Windows client.
2. Run the following command in an Administrator PowerShell session from inside the unzipped folder (You can also see it here on [github](/scripts/install_sysmon.ps1)):
```powershell
.\scripts\install_sysmon.ps1
```
You may need to temporarily set the PowerShell script execution policy to "Unrestricted" to allow the execution of downloaded scripts. Use the following command to do so:
```powershell
Set-ExecutionPolicy Unrestricted
```
## 4. Next Steps
Refer to the common questions below and consult our [documentation](#5-documentation) for additional information.
### Retrieving Passwords:
Navigate to the LME directory:
```bash
cd ~/LME
```
To view the service user passwords, run the following command:
```bash
./scripts/extract_secrets.sh -p
```
**NOTE: Manually changing these passwords in the encrypted file, or via others means (I.E. manually changing the elastic logon password in Kibana) will break connectivity between containers.**
For more information about passwords, see [here](/docs/markdown/reference/passwords.md).
### Starting and Stopping LME:
To manage the LME services, use the following commands:
- **Stop all LME services:**
```bash
sudo -i systemctl stop lme.service
```
- **Restart all LME services:**
```bash
sudo -i systemctl restart lme.service
```
- **Start all LME services:**
```bash
sudo -i systemctl start lme.service
```
### Uninstall LME
To completely uninstall LME's services and data, follow these steps. Note that dependencies will not be removed. You can consult the Ansible scripts to identify and remove the installed dependencies and created directories if desired.
<span style="color:red">**Warning: This will delete all LME data and services.**</span>
#### Complete Uninstall
1. **Stop LME services:**
```bash
sudo systemctl stop lme*
```
2. **Reset systemd service states:**
```bash
sudo systemctl reset-failed
```
3. **Remove all Podman volumes:**
```bash
sudo -i podman volume rm -a
```
4. **Remove all Podman secrets:**
```bash
sudo -i podman secret rm -a
```
5. **Delete LME directories:**
```bash
sudo rm -rf /opt/lme /etc/lme /etc/containers/systemd
```
6. **Reset Podman <span style="color:red">(Do not run this if you have other Podman containers)</span>:**
```bash
sudo -i podman system reset --force
```
<span style="color:red">**Warning: This will delete all LME data and services.**</span>
#### Optional Uninstall Steps
1. **Stop LME services:**
```bash
sudo systemctl stop lme*
sudo systemctl disable lme.service
sudo -i podman stop $(sudo -i podman ps -aq)
sudo -i podman rm $(sudo -i podman ps -aq)
```
2. **Delete LME volumes:**
- To delete only LME volumes:
```bash
sudo -i podman volume ls --format "{{.Name}}" | grep lme | xargs podman volume rm
```
- To delete all volumes:
```bash
sudo -i podman volume rm -a
```
### Customizing LME:
We're doing our best to have regular updates that add new and/or requested features. A few ideas for customizing your installation to your needs. Please see the appropriate section of our documentation for more information on each topic.
1. [Alerting](/docs/markdown/maintenance/elastalert-rules.md): Adding custom notifications for triggered alerts using elastalert2
2. [Active Response](/docs/markdown/agents/wazuh-active-response.md): Creating custom wazuh active response actions to automatically respond to a malicious event wazuh detects.
3. [Backups](/docs/markdown/maintenance/backups.md): Customizing backups of logs for your organizations own compliance needs.
4. [Custom log types](/docs/markdown/agents/elastic-agent-management.md#lme-elastic-agent-integration-example): using elastic agents built in [integrations](https://www.elastic.co/guide/en/integrations/current/index.html) ingest a log type specific to your organization.
## 5. Documentation
### Logging Guidance
- [LME in the Cloud](/docs/markdown/logging-guidance/cloud.md)
- [Log Retention](/docs/markdown/logging-guidance/retention.md)
- [Filtering](/docs/markdown/logging-guidance/filtering.md)
### Reference:
- [FAQ](/docs/markdown/reference/faq.md)
- [Dashboard Descriptions](/docs/markdown/reference/dashboard-descriptions.md)
- [Security Model](/docs/markdown/reference/security-model.md)
- [Architecture](/docs/markdown/reference/architecture.md)
- [Configuration Customization Options](/docs/markdown/reference/configuration.md)
- [Password Maintenance](/docs/markdown/reference/passwords.md)
- [Troubleshooting](/docs/markdown/reference/troubleshooting.md)
### Maintenance:
- [Alerting](/docs/markdown/maintenance/elastalert-rules.md)
- [Backups](/docs/markdown/maintenance/backups.md)
- [Certificates](/docs/markdown/maintenance/certificates.md)
- [Encryption at Rest](/docs/markdown/maintenance/Encryption_at_rest_option_for_users.md)
- Data management:
- [Index Management](/docs/markdown/maintenance/index-management.md)
- [Volume Management](/docs/markdown/maintenance/volume-management.md)
- Upgrading:
- [Upgrading 1x -> 2x](/scripts/upgrade/README.md)
- [Upgrading Future 2.x](/docs/markdown/maintenance/upgrading.md)
### Agents:
Here is documentation on agent configuration and management.
- [Elastic-Agent](/docs/markdown/agents/elastic-agent-management.md)
- Wazuh:
- [Wazuh Configuration](/docs/markdown/maintenance/wazuh-configuration.md)
- [Active Response](/docs/markdown/agents/wazuh-active-response.md)
- [Agent Management](/docs/markdown/agents/wazuh-agent-management.md)
### Endpoint Tools:
To make best use of the agents, complement them with utilities that generate forensically relevant data to analyze and support detections.
Consider adding them to Windows/Linux.
#### Windows:
- [Sysmon (manual install)](/docs/markdown/endpoint-tools/install-sysmon.md)
#### Linux:
- [Auditd](/docs/markdown/endpoint-tools/install-auditd.md)
## 6. Developer Notes
Git clone and git checkout your development branch on the server:
```bash
git clone https://github.com/cisagov/LME.git
cd LME
git checkout YOUR_BRANCH_NAME_HERE
```
Once you've gotten your changes/updates added, please submit a pull request following our [guidelines](/CONTRIBUTING.md)
## non-default installation notes:
If you installed LME in a custom directory, you can pass the `CLONE_DIRECTORY` variable to the playbook.
```bash
ansible-playbook ./ansible/install_lme_local.yml -e "clone_dir=/path/to/clone/directory"
```
**If you have issues accessing a file or directory, please note permissions and notes on folder structure [here](#notes-on-folders-permissions-and-service)**
This also assumes your user can sudo without a password. If you need to input a password when you sudo, you can run it with the `-K` flag and it will prompt you for a password.
```bash
ansible-playbook -K ./ansible/install_lme_local.yml -e "clone_dir=/path/to/clone/directory"
```
In the `BECOME password` prompt enter the password for your user you would normally give `sudo`, so the playbook is able to sudo as expected.
### Installation details:
Below we've documented in more detail what exactly occurs during the installation and post-installation ansible scripts.
#### Steps performed in automated install:
1. Setup /opt/lme and check for sudo access. Configure other required directories/files.
2. **Setup password information**: Configures the password vault and other configuration for the service user passwords.
3. **Setup [Nix](https://nixos.org/)**: nix is the open source package manager we use to install the latest version of podman.
4. **Set service user passwords**: Sets the service user passwords that are encrypted according to the [security model](/docs/markdown/reference/security-model.md).
5. **Install Quadlets**: Installs quadlet files in the directories described below to be setup as systemd services.
6. **Setup Containers for root**: The containers listed in `$clone_directory/config/containers.txt` will be pulled and tagged.
7. **Start lme.service**: Kicks off the start of LME service containers.
**Notes on folders, permissions, and service:**
1. `/opt/lme` will be owned by root, all LME services will run and execute as unprivileged users. The active LME configuration is stored in `/opt/lme/config`.
To access any file at `/opt/lme/` you'll need to make sure you're in a root shell (e.g. `sudo -i su`) or you run whatever command you're wanting to access in that directory as root (e.g. `sudo ls /opt/lme/config`)
2. Other relevant directories are listed here:
- `/root/.config/containers/containers.conf`: LME will setup a custom podman configuration for secrets management via [ansible vault](https://docs.ansible.com/ansible/latest/cli/ansible-vault.html).
- `/etc/lme`: storage directory for the master password and user password vault
- `/etc/lme/pass.sh`: the master password file
- `/etc/containers/systemd`: directory where LME installs its quadlet service files
- `/etc/systemd/system`: directory where lme.service is installed
3. The master password will be stored at `/etc/lme/pass.sh` and owned by root, while service user passwords will be stored at `/etc/lme/vault/`
4. lme.service is a KICK START systemd service. It will always succeed and is designed so that the other lme services can be stopped and restarted by stopping/restarting lme.service.
For example, to stop all of LME:
```bash
sudo -i systemctl stop lme.service
```
To restart all of LME:
```bash
sudo -i systemctl restart lme.service
```
To start all of LME:
```bash
sudo -i systemctl start lme.service
```
#### Other Post-Install Setup:
A few other things are needed and you're all set to go.
1. Setting up Elasticfleet
2. Fixing a few issues with Wazuh (in a future release this won't be necessary)
3. Setting up custom LME dashboards
4. Setting up Wazuh's dashboards
5. Setting up a read only user for analysts to connect and query LME's data
Luckily we've packed this in a script for you. Before running it we want to make sure our Podman containers are healthy and setup. Run the command `sudo -i podman ps --format "{{.Names}} {{.Status}}"`
```bash
lme-user@ubuntu:~/LME-TEST$ sudo -i podman ps --format "{{.Names}} {{.Status}}"
lme-elasticsearch Up 49 minutes (healthy)
lme-wazuh-manager Up 48 minutes
lme-kibana Up 36 minutes (healthy)
lme-fleet-server Up 35 minutes
```
", Assign "at most 3 tags" to the expected json: {"id":"4355","tags":[]} "only from the tags list I provide: [{"id":77,"name":"3d"},{"id":89,"name":"agent"},{"id":17,"name":"ai"},{"id":54,"name":"algorithm"},{"id":24,"name":"api"},{"id":44,"name":"authentication"},{"id":3,"name":"aws"},{"id":27,"name":"backend"},{"id":60,"name":"benchmark"},{"id":72,"name":"best-practices"},{"id":39,"name":"bitcoin"},{"id":37,"name":"blockchain"},{"id":1,"name":"blog"},{"id":45,"name":"bundler"},{"id":58,"name":"cache"},{"id":21,"name":"chat"},{"id":49,"name":"cicd"},{"id":4,"name":"cli"},{"id":64,"name":"cloud-native"},{"id":48,"name":"cms"},{"id":61,"name":"compiler"},{"id":68,"name":"containerization"},{"id":92,"name":"crm"},{"id":34,"name":"data"},{"id":47,"name":"database"},{"id":8,"name":"declarative-gui "},{"id":9,"name":"deploy-tool"},{"id":53,"name":"desktop-app"},{"id":6,"name":"dev-exp-lib"},{"id":59,"name":"dev-tool"},{"id":13,"name":"ecommerce"},{"id":26,"name":"editor"},{"id":66,"name":"emulator"},{"id":62,"name":"filesystem"},{"id":80,"name":"finance"},{"id":15,"name":"firmware"},{"id":73,"name":"for-fun"},{"id":2,"name":"framework"},{"id":11,"name":"frontend"},{"id":22,"name":"game"},{"id":81,"name":"game-engine "},{"id":23,"name":"graphql"},{"id":84,"name":"gui"},{"id":91,"name":"http"},{"id":5,"name":"http-client"},{"id":51,"name":"iac"},{"id":30,"name":"ide"},{"id":78,"name":"iot"},{"id":40,"name":"json"},{"id":83,"name":"julian"},{"id":38,"name":"k8s"},{"id":31,"name":"language"},{"id":10,"name":"learning-resource"},{"id":33,"name":"lib"},{"id":41,"name":"linter"},{"id":28,"name":"lms"},{"id":16,"name":"logging"},{"id":76,"name":"low-code"},{"id":90,"name":"message-queue"},{"id":42,"name":"mobile-app"},{"id":18,"name":"monitoring"},{"id":36,"name":"networking"},{"id":7,"name":"node-version"},{"id":55,"name":"nosql"},{"id":57,"name":"observability"},{"id":46,"name":"orm"},{"id":52,"name":"os"},{"id":14,"name":"parser"},{"id":74,"name":"react"},{"id":82,"name":"real-time"},{"id":56,"name":"robot"},{"id":65,"name":"runtime"},{"id":32,"name":"sdk"},{"id":71,"name":"search"},{"id":63,"name":"secrets"},{"id":25,"name":"security"},{"id":85,"name":"server"},{"id":86,"name":"serverless"},{"id":70,"name":"storage"},{"id":75,"name":"system-design"},{"id":79,"name":"terminal"},{"id":29,"name":"testing"},{"id":12,"name":"ui"},{"id":50,"name":"ux"},{"id":88,"name":"video"},{"id":20,"name":"web-app"},{"id":35,"name":"web-server"},{"id":43,"name":"webassembly"},{"id":69,"name":"workflow"},{"id":87,"name":"yaml"}]" returns me the "expected json"